Financial Highlights - 2018
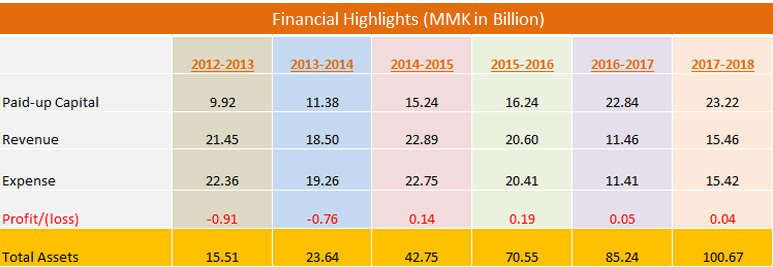
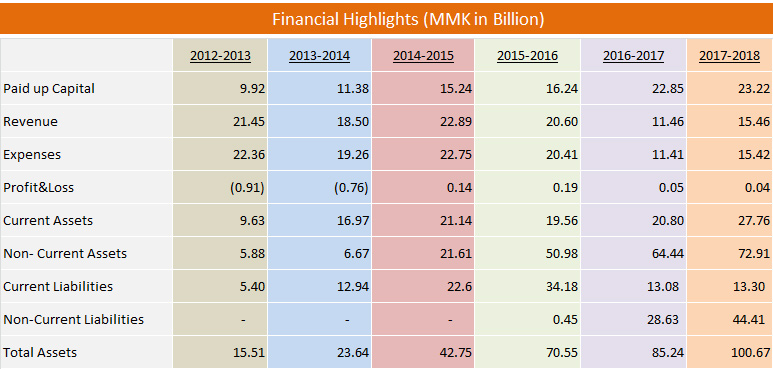
Notes-2012-2013,2013-2014, MAPCO Only
2014-2015,2015-2016, 2016-2017 ,2017-2018 Consolidated Report
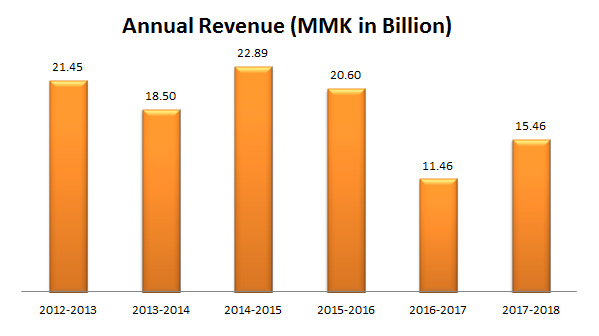
Annual Revenue
| Revenue (Billion) | |
|---|---|
| 2012-13 | 21.45 |
| 2013-14 | 18.50 |
| 2014-15 | 22.89 |
| 2015-16 | 20.60 |
| 2016-17 | 11.46 |
| 2017-18 | 15.46 |
| Remarks: MMK in Billion | |
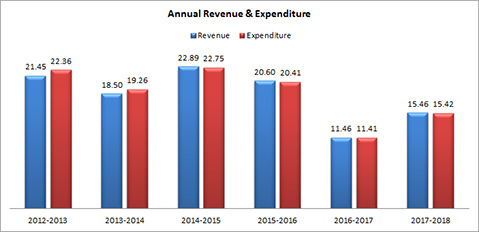
Annual Revenue & Expenditure
| Revenue | Expenditure | |
|---|---|---|
| 2012-13 | 21.45 | 22.36 |
| 2013-14 | 18.50 | 19.26 |
| 2014-15 | 22.89 | 22.75 |
| 2015-16 | 20.60 | 20.41 |
| 2016-17 | 11.46 | 11.41 |
| 2017-18 | 15.46 | 15.42 |
| Remarks: MMK in Billion | ||
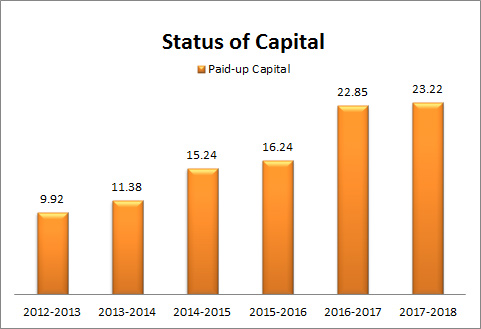
Capital
| Paid-Up Capital | |
|---|---|
| 2012-13 | 9.92 |
| 2013-14 | 11.38 |
| 2014-15 | 15.24 |
| 2015-16 | 16.24 |
| 2016-17 | 22.85 |
| 2017-18 | 23.22 |
| Remarks: MMK in Billion | |
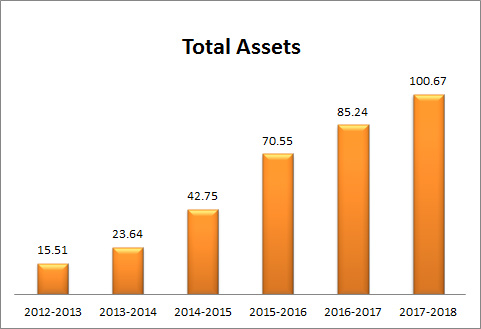
Total Assets
| Total Assets | |
|---|---|
| 2012-13 | 15.51 |
| 2013-14 | 23.64 |
| 2014-15 | 42.75 |
| 2015-16 | 70.55 |
| 2016-17 | 85.24 |
| 2017-18 | 100.67 |
| Remarks: MMK in Billion | |
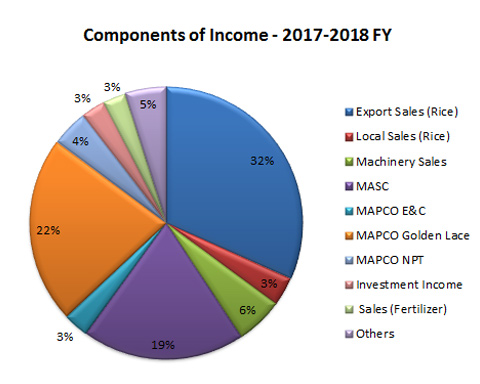
Component of Income 2017-2018
| Components of Income | MMK (in Billion) | % |
|---|---|---|
| Export Sales (Rice) | 4.89 | 32% |
| Local Sales (Rice) | 0.53 | 3% |
| Machinery Sales | 0.87 | 6% |
| MASC | 2.99 | 19% |
| MAPCO E&C | 0.46 | 3% |
| MAPCO Golden Lace | 3.43 | 22% |
| MAPCO NPT | 0.67 | 4% |
| Investment Income | 0.45 | 3% |
| Sales (Fertilizer) | 0.42 | 3% |
| Others | 0.75 | 5% |
| 15.46 | 100% |
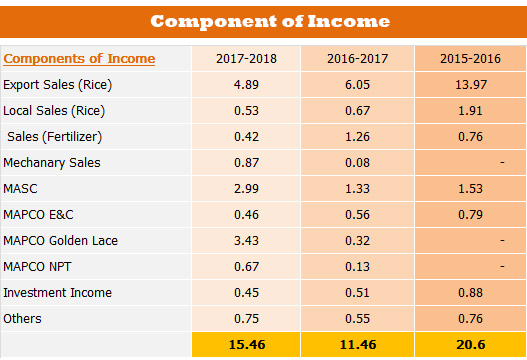
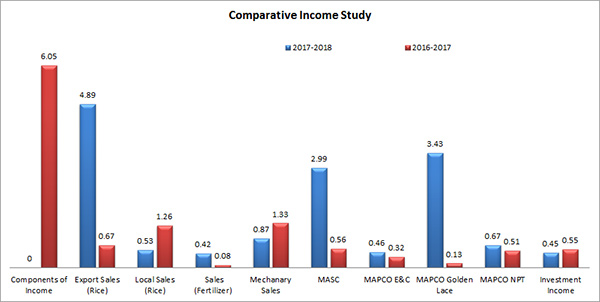
Comparative Study: 2017-2018 and 2016-17
| Components of Income | 2017-2018 | 2016-17 |
|---|---|---|
| Export Sales (Rice) | 4.89 | 6.05 |
| Local Sales (Rice) | 0.53 | 0.67 |
| Sales (Fertilizer) | 0.42 | 1.26 |
| Machinery Sales | 0.87 | 0.08 |
| MASC | 2.99 | 1.33 |
| MAPCO E&C | 0.46 | 0.56 |
| MAPCO Golden Lace | 3.43 | 0.32 |
| MAPCO NPT | 0.67 | 0.13 |
| Investment Income | 0.45 | 0.51 |
| Others | 0.75 | 0.55 |
| 15.46 | 11.46 | |
| (MMK in Billion) |